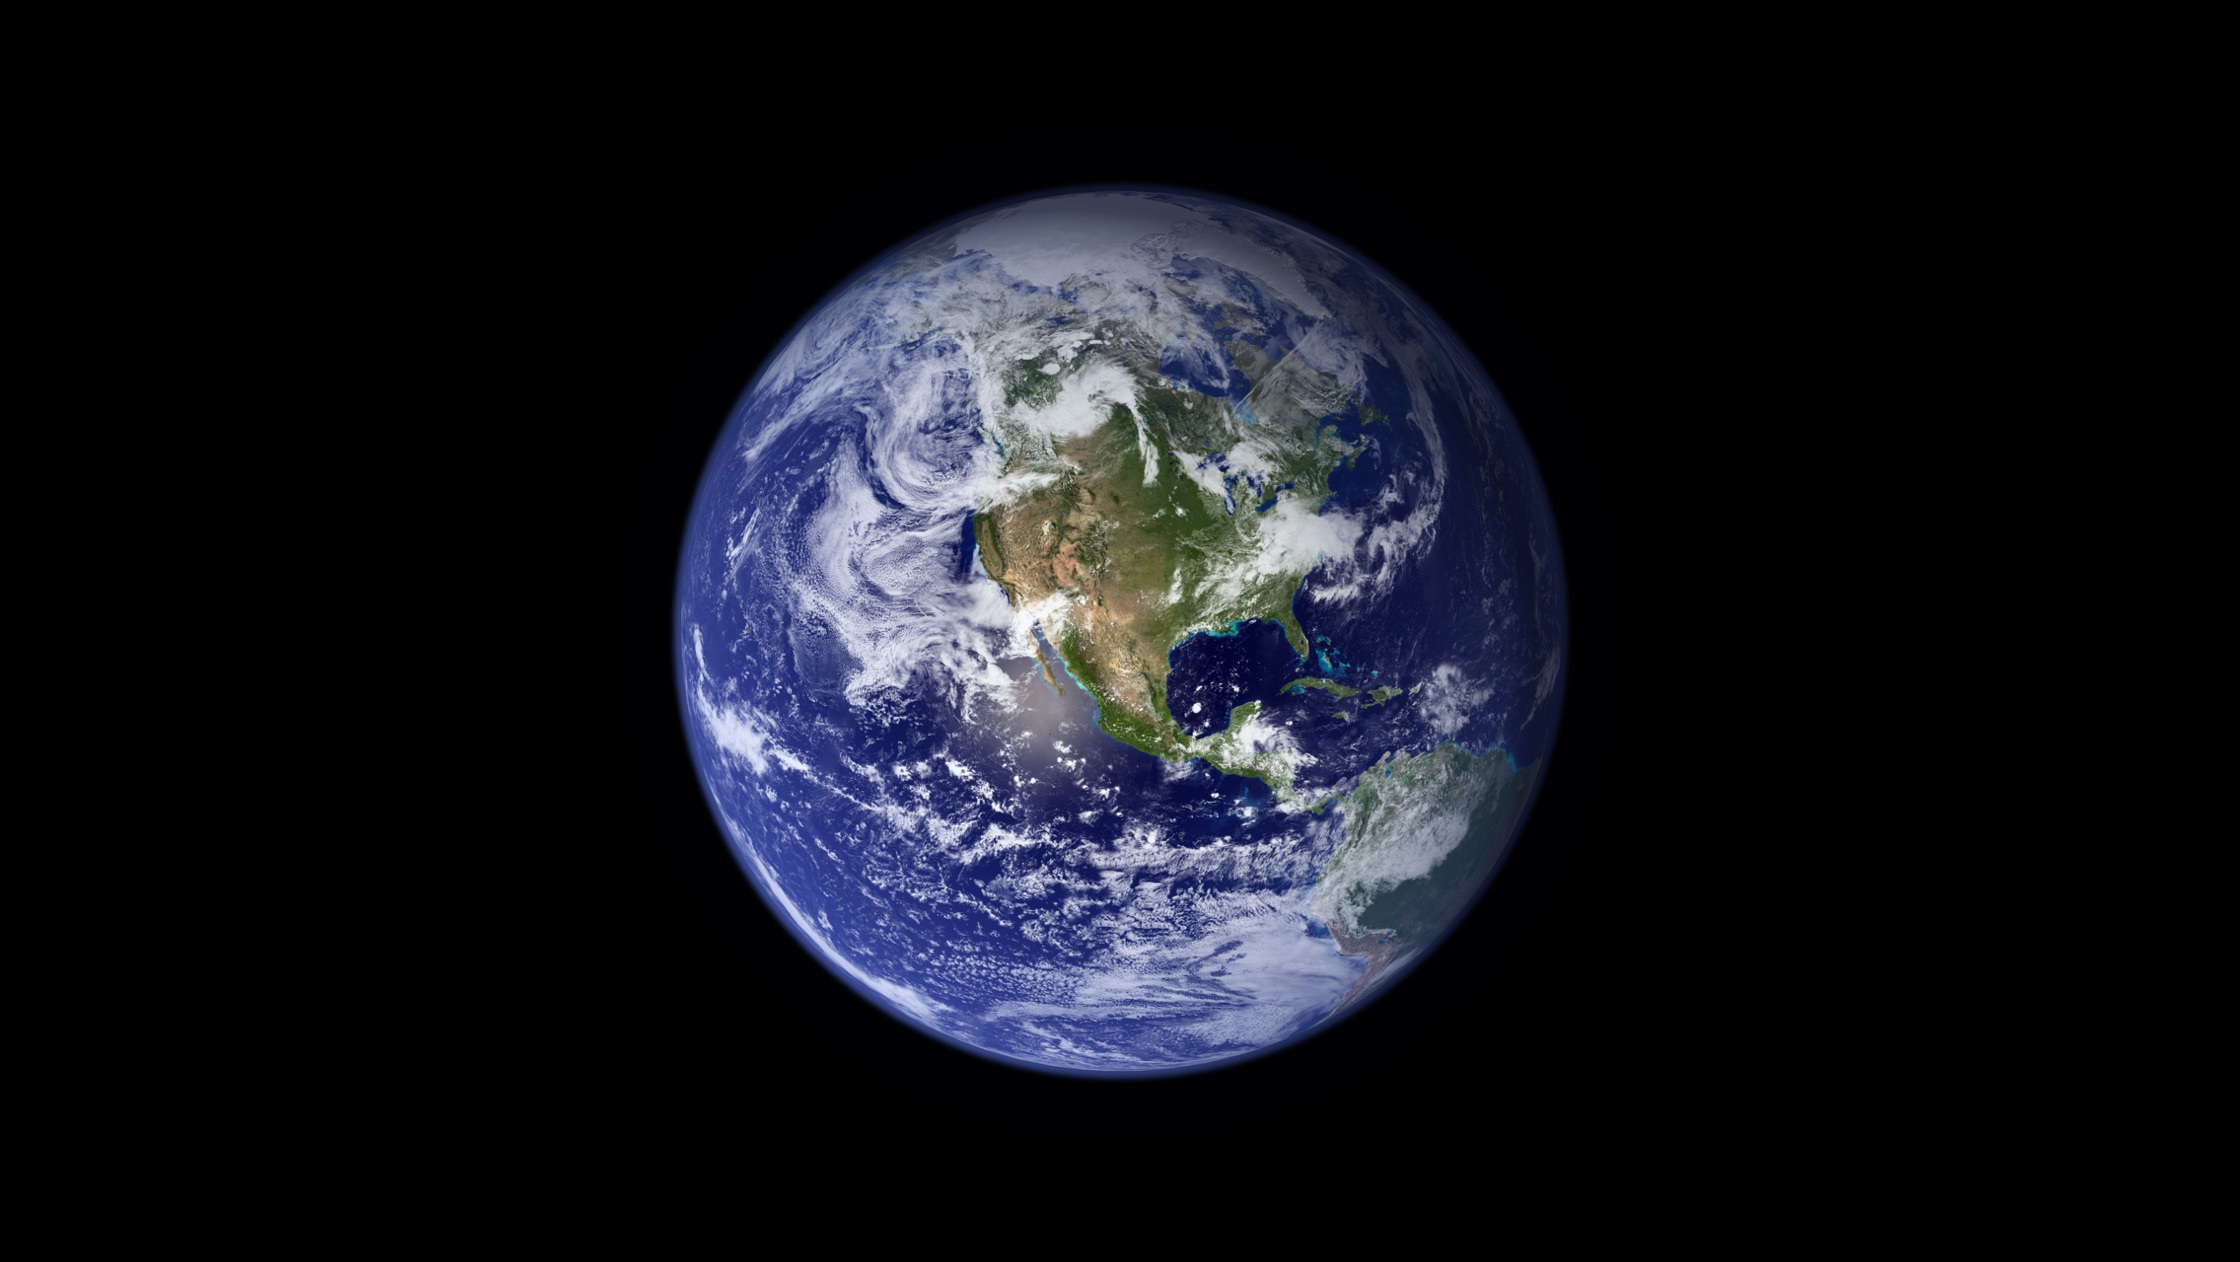
Planet A

Age:
4.6 bill. years

Surface:
510.1 mill. km²

Equatorial Diameter:
12.756,27 km

Average Temperature:
15 °C (59 °F)

Air Pressure:
1.014 bar

Mass

Total
5.9724 E24 kg

Composition
Iron: 32.1 %
Oxygen: 30.1 %
Silicon: 15.1 %
Magnesium: 13.9 %
Sulfur: 2.9 %
Nickel: 1.8 %
Calcium: 1.5 %
Aluminium: 1.4 %
Trace elements: 1.2 %

Atmosphere

Composition
Nitrogen: 78.08 %
Oxygen: 20.95 %
Argon: 0.93 %
Carbon dioxide: 0.042 %
Neon: 0.002 %

Distances

to Moon:
383,398 km (60 × earth diameter)

to Mars:
54.6 mill. km

to Sun:
149.6 mill. km

Finite Resource

Erich Bendl, September 21 2020
2 min to read

Topic: The Future of Farming

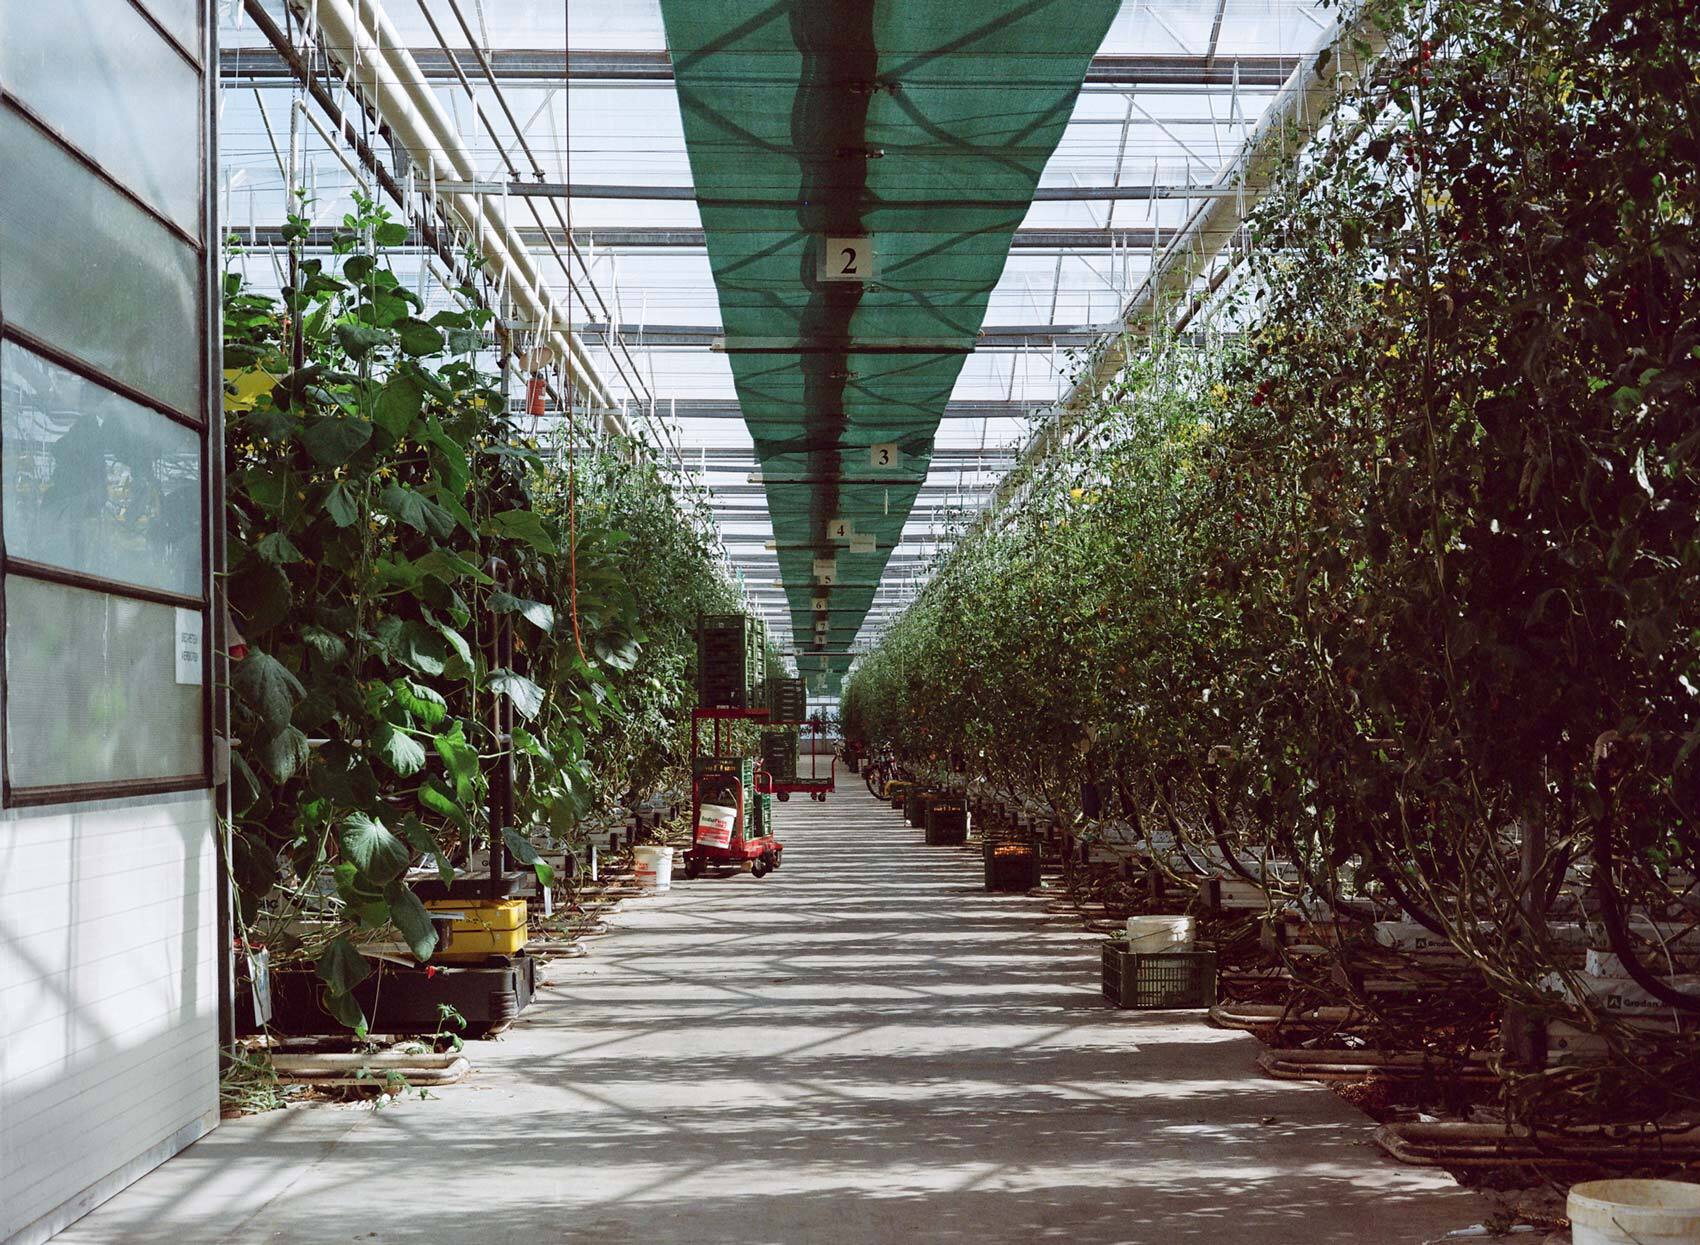
The earth is currently the habitat of 7.8 billion people. Virtually one half of these live in cities, which, in turn, only make up 3 % of the earth's surface. We asked ourselves about the geographical and spatial background to the discussion about the “Future of Farming” that we are addressing in this edition. It is easy for developments such as the digitalisation and automation of agricultural production to distract us from the fact that we will always need physical spaces in which farming can take place.

In view of the growing global population, tangibly changing climatic conditions and increasing levels of pollution, the question of how we can maintain the land resources that our planet offers us for the production of our food is becoming ever more urgent.

The aim of the following visual essay, which is based on numbers and diagrams, is to make us all even more conscious of the finite nature of our most important resource.

Earth Surface structure

Water
70.7 %
360,570,000 km²

Land (without Cities)
26.3%
134,130,000 km2

Cities
3 %
15,300,000 km²

Sources: Wikipedia, watson.ch

Surface structure of the land areas

Arable Land
32.86 %
49,116,226 km²

Natural spaces
27.64 %
41,313,584 km²

Forests
26.95 %
40,274,680 km²

Antarctica
9.47%
14,148,361 km²

Inland Waters
3.06%
4,577,149 km²

Sources: Wikipedia, watson.ch

The equivalent of one soccer pitch of soil is eroded every five seconds.

1

Climate zones

Cold Zone

Location: 60-90° northern and southern latitudes
Position of the sun: 53° above/below the horizon
Temperature: -47 to 0 °C average,
-89 °C min, 25 °C max
Length of the day: 0-24 hours
Climate: ice and tundra

Temperate Zone

Location: 40-60° northern and southern latitudes
Position of the sun: from 73° to 0°
Temperature: 0-20 °C average,
-40 °C min, +40 °C max
Length of the day: 4-16 hours
Climate: warm or cool

Subtropical Zone

Location: 23.5-40° northern and southern latitudes
Position of the sun: 90-27° above the horizon
Temperature: >20-35 °C average,
-5 °C min, 66 °C max
Length of the day: 9-15 hours
Climate: tropical summer, non-tropical winter

Tropical Zone

Location: 0-23.5° northern and southern latitudes
Position of the sun: 90-43° above the horizon
Temperature: >20-30 °C average,
0 °C min, 40 °C max
Length of the day: 10-13.5 hours
Climate: humid-warm

Data: meteoblue.com, Map: Wikipedia

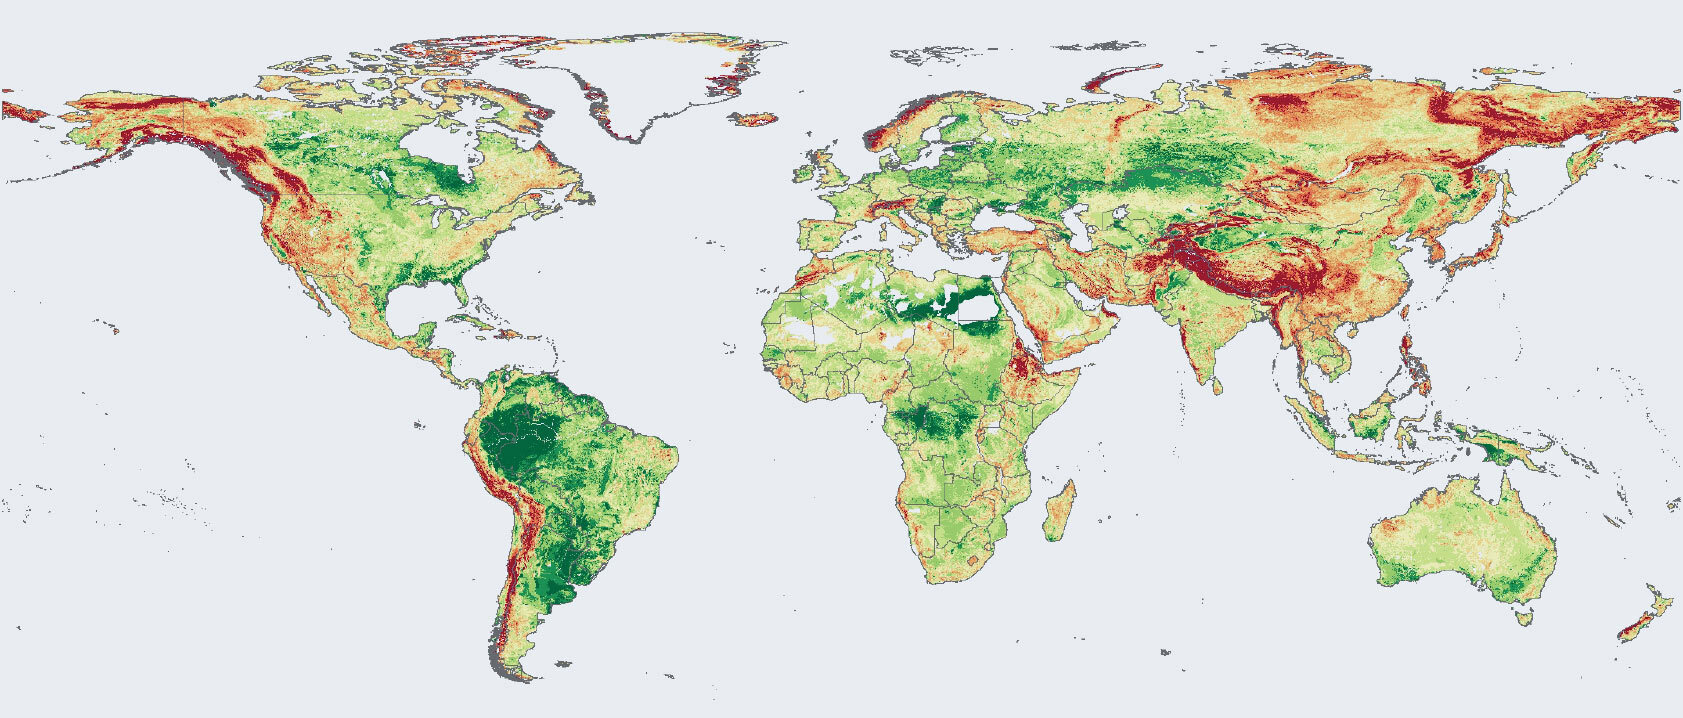
As a result of misuse, around 24 billion tons of fertile ground are lost every year.

2

Predicted Soil Loss

Source: FAO

IT CAN TAKE UP TO 1.000 YEARS TO PRODUCE JUST 2-3 CM OF SOIL.

3

Population size / continent

population 2020

population 2100

more than 347 inhabitants/km2

Data: Statista, Density Map: metrocosm © Max Galka

Over the last 20 years the extent of land area harvested has increased by 16 %, the area under irrigation has doubled and agricultural production has grown nearly three fold. Yet, close to one billion people remain undernourished.

4

Data: Wikipedia

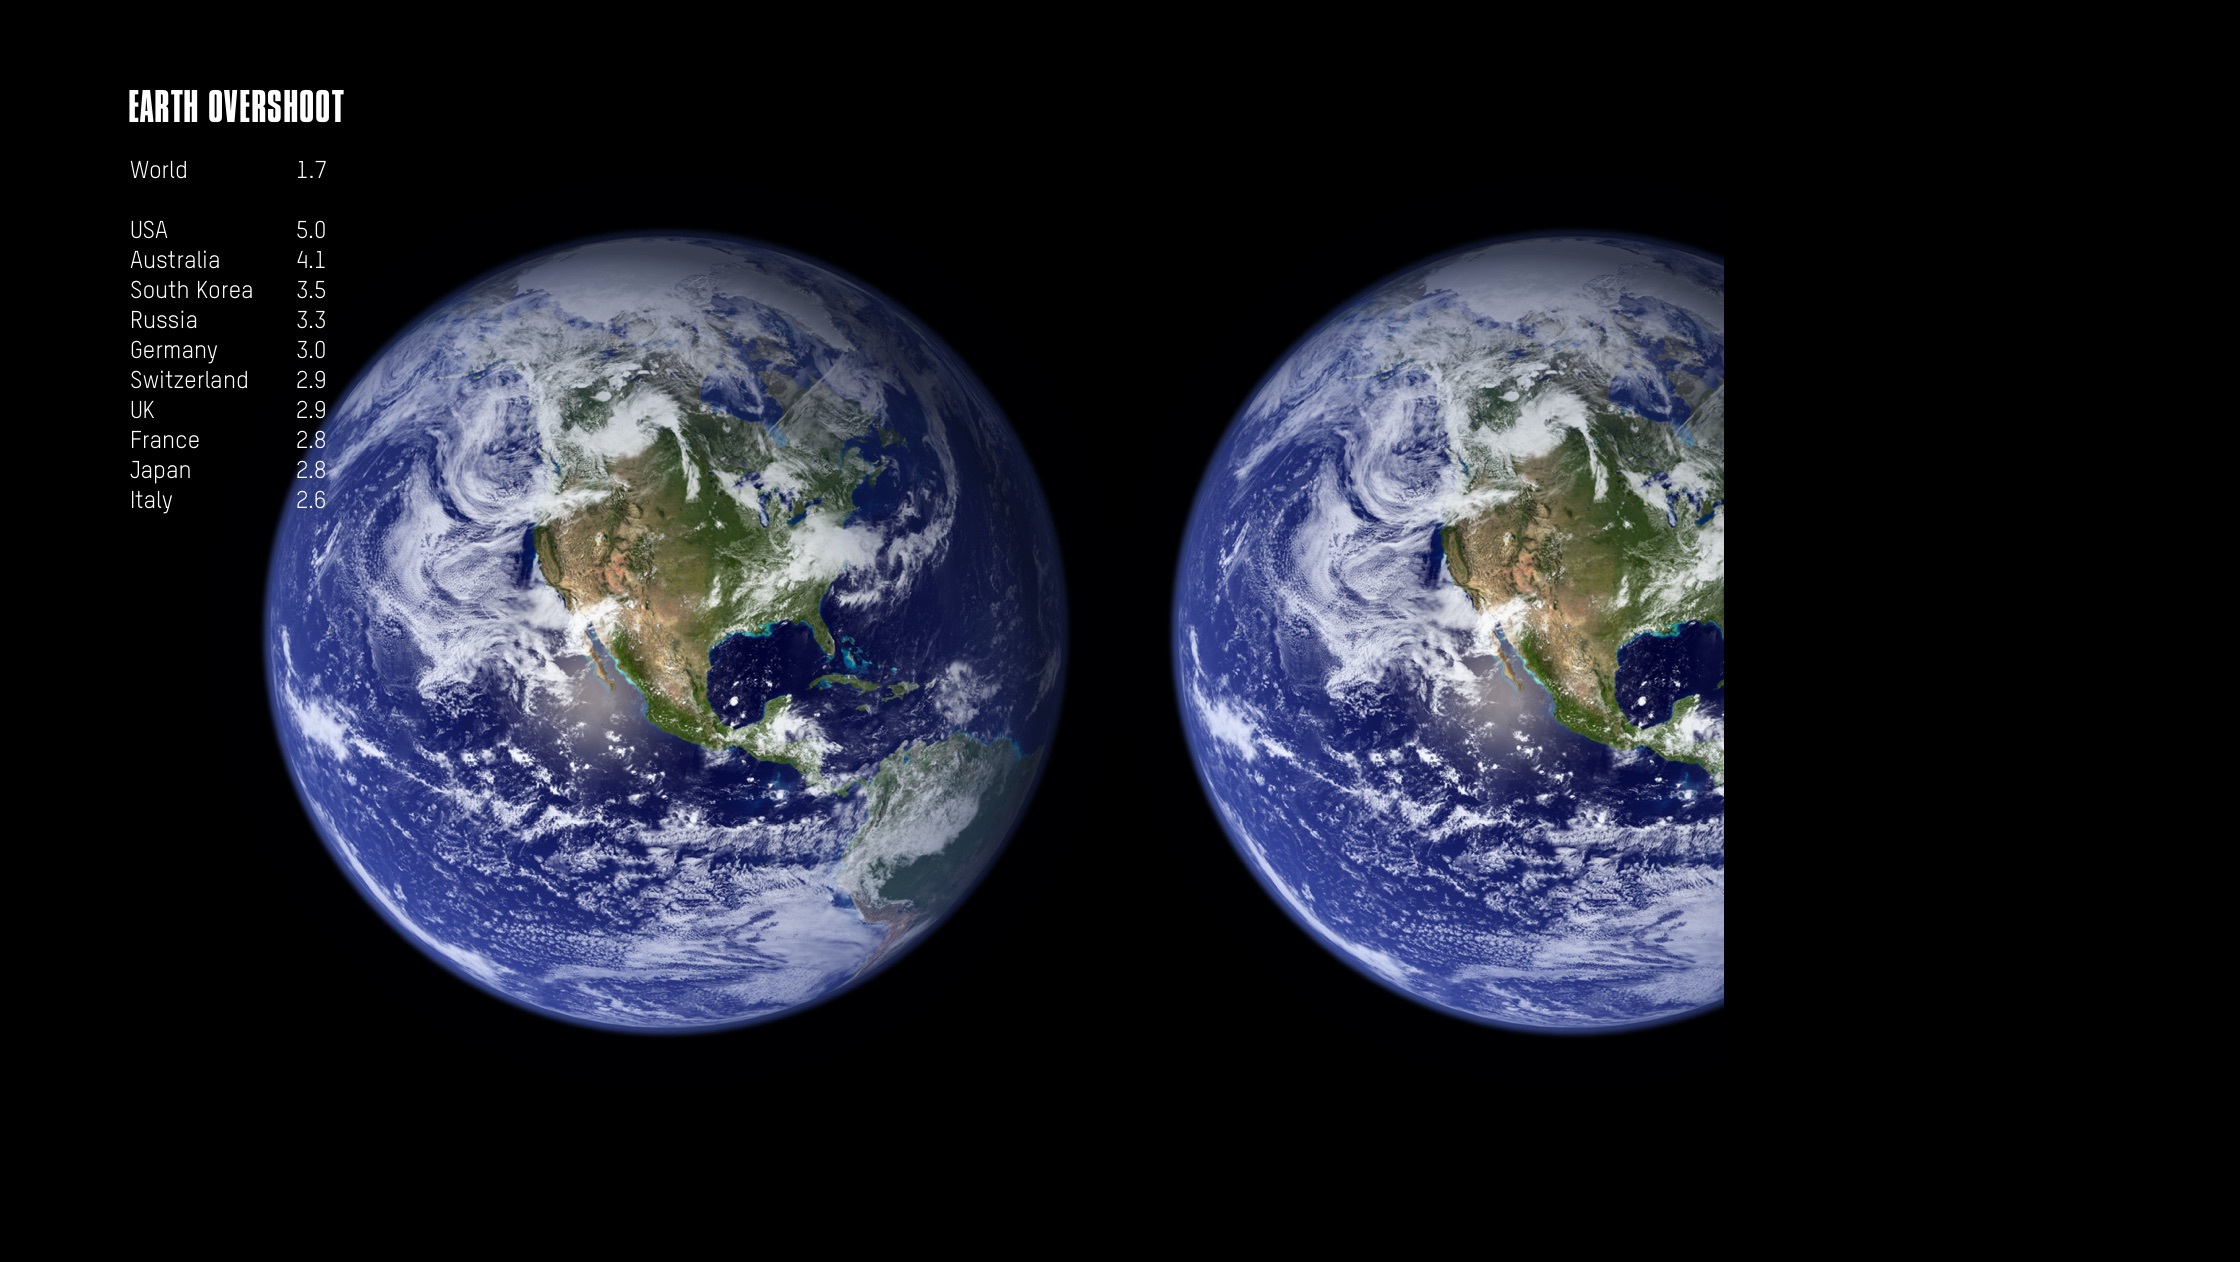
The limited nature of land as a resource is particularly powerfully demonstrated on so-called “Earth Overshoot Day”. Each year, the Global Footprint Network calculates the date upon which the human consumption of raw materials exceeds the ability of the earth to reproduce them. In 2019, Earth Overshoot Day was 19th July. This means that we consume the resources of 1.7 planets. As a result of the corona pandemic this date fell back in 2020 around one month, to 22nd August, which also signifies that consumption fell this year to 2005 levels.


Footnotes

1 FAO
2 Bodenatlas (PDF)
3 FAO
4 WAD_FeedningPopularity.pdf

Cover

Data: Wikipedia, Image: Wikipedia